Molecular docking and DFT based QSAR study on Oleanolic acid derivatives as Protein-tyrosine phosphatase 1B inhibitors
Pranab Ghosh
DOI10.21767/2469-6692.10024
Pranab Ghosh1*, Bhaskar Bagchi2 and Asim Kumar Bothra2
1Department of Chemistry, University of North Bengal, Darjeeling-734013, West Bengal, India
2Cheminformatics Bioinformatics Lab, Department of Chemistry, Raiganj University, P.O. Raiganj, Dist. Uttar Dinajpur, Pin-733134, India
- *Corresponding Author:
- Pranab Ghosh
Department of Chemistry
University of North Bengal
Darjeeling-734013, West Bengal, India
Tel: 9474441468
Fax: 91-353-2699001
E-mail: pizy12@yahoo.com
Received Date: March 26, 2018; Accepted Date: April 25, 2018; Published Date: February 05, 2018
Citation: Ghosh P, Bagchi B, Bothra AK (2018) Molecular Docking and DFT Based QSAR Study on Oleanolic Acid Derivatives as Protein-Tyrosine Phosphatase 1B Inhibitors. J In Silico In Vitro Pharmacol 4:2. DOI: 10.21767/2469-6692.10024
Abstract
Protein-tyrosine phosphatase 1B (PTP1B) is an attractive target for the treatment of type 2 diabetes. Oleanolic acid and its derivatives were found to be potent PTP1B inhibitors. In this study, we have performed QSAR studies followed by molecular docking. The docking study shows that most of the ligands can form hydrogen bonds with ARG24 and/or ARG254. Two quantitative structure activity relationships models have been constructed using different descriptors and the significance of these models is judged on the basis of correlation, Fischer F test, and quality factor (Q). It is believed that this study is helpful in the design of potent PTP1B inhibitors.
Keywords
PTP1B; Oleanolic acid; Docking; QSAR; DFT
Introduction
Protein-tyrosine phosphatase 1B (PTP1B) is an attractive target for the treatment of type 2 diabetes and is found in a wide variety of human tissues [1,2]. The removal of the phosphoryl group from phosphotyrosine residue (s) in protein substrates by Protein-tyrosine phosphatases (PTPs) and the reverse action by protein tyrosine kinases is a common mechanism for the control of biological pathways [2-4].
PTP1B is the prototypical intracellular PTPs serves as a key negative regulator of insulin signaling pathway [5] and is over expressed in human breast cancer [6]. Knock-out studies suggest that the lack of PTP1B would result in increased insulin sensitivity and suppression of weight gain in mice [7].
Oleanane type triterpenes possess exciting pharmacological properties, including the anti-inflammatory, hypolipidemic, antioxidant, antidiabetic, microbicid and antiatherosclerotic actions [8-10]. They interfere in the neuro degenerative disorders and in the development of different types of cancer (Martín et al. 2010). Inhibition of PTP1B by oleanolic acid improves insulin sensitivity and stimulates glucose uptake [11]. Molecular docking studies indicate that triterpenes bind in the aryl phosphate binding site not in the catalytic site [12,13].
In this study, we have performed QSAR study followed by molecular docking with a series of oleanolic acid derivatives to explore the important properties of potent and selective PTP1B inhibitors.
Materials and Methods
Molecular docking of the oleanolic acid derivatives to PTP1B enzyme.
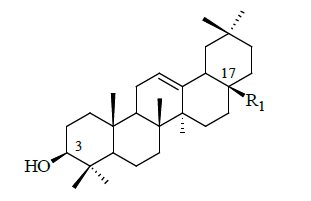
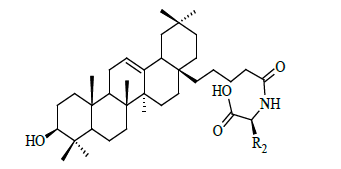
A total of 35 oleanolic acid derivatives published from the literature (Zhang et al. 2008) were used for the molecular docking and QSAR studies. The initial structures of 35 compounds used in this study were generated by ChemSketch (https://www.acdlabs.com/resources/freeware/chemsketch/). The structure coordinates of PTP1B in complex with OAI (1C83.pdb) were obtained from the RCSB protein data bank (www.rcsb.org). The oleanolic acid derivatives were docked into the active pocket of the enzyme by using docking program Autodock 4.0 (Morris et al. 1998). Initially the structure of the ligands has been optimized with Austin Model 1 (AM1) parameterization and the hydrogen atoms were added to the enzyme. The Lamarckian genetic algorithm (LGA) was applied to search for the best conformers. A grid map with 60 × 50 × 40 points and 0.375 Å spacing was used in Autogrid program to evaluate the binding energies between the inhibitors and PTP1B. The grid centre was set at the active site position 47.411, 9.703 and 4.79 and the default settings were used. For each compound ten docking poses saved and ranked by binging energy. The lowest free energy conformation was chosen for analyzing the type of interactions. Visualization of the protein-ligand complex was performed using Molegro molecular viewer software (https://www.molegro.com/index.php). The lowest energy geometry of the inhibitors obtained from docking was used for the QSAR study.
Descriptors and Data Set For QSAR
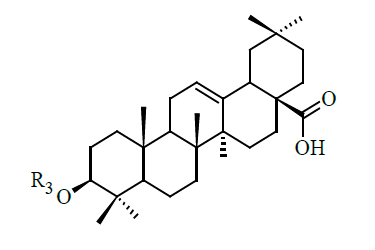
The biological property of this data set is reported as IC50 (μM) values. This value was changed to the minus logarithmic scale [pIC50] and used for subsequent QSAR analysis as the response variable. Structural details of the 35 compounds and their biological activity are listed in Table 1. We attempted several descriptors and it is found that binding energy (EB), HOMO energy (EH), LUMO energy (EL), dipole moment (μ), molar refractivity (MR), molar volume (MV), solvent accessible surface area (SASA) and the octanol/water partition coefficient (logP) can better represent the biological activity of the selected compounds.
| Compound no | R1 | IC50 (µM) |
|---|---|---|
| 1 | COOH | 3.37 |
| 2 | (CH2)2-COOH | 2.10 |
| 3 | (CH2)4-COOH | 1.33 |
| 4 | (CH2)8-COOH | 0.78 |
| 5 | CONH2 | 4.76 |
| 6 | (CH2)10-COOH | 0.72 |
| 7* | COOMe | 4.44 |
| 8* | (CH2)12-COOH | 0.59 |
| 9 | 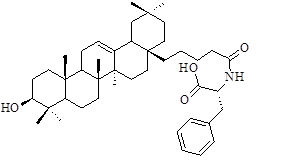 |
0.74 |
| 10* | 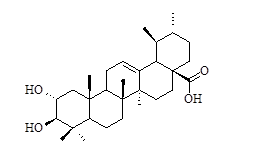 |
5.49 |
| Sl | R2 | IC50 (µM) |
|---|---|---|
| 11 |  |
0.57 |
| 12 | 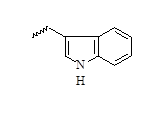 |
0.59 |
| 13 | (CH2)2-SMe | 0.55 |
| 14 | 2-Cl-Ph | 0.56 |
| 15 | 3-Cl-Ph | 0.51 |
| 16 | 4-Cl-Ph | 0.61 |
| 17 | 4-F-Ph | 0.57 |
| 18 | 2-Me-Ph | 0.55 |
| 19 | 4-NO2-Ph | 0.45 |
| 20 | 2-OMe-Ph | 0.53 |
| 21 | 3-OMe-Ph | 0.52 |
| 22 | 4-OMe-Ph | 0.60 |
| 23 |  |
0.44 |
| 24 | 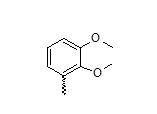 |
0.66 |
| 25 |  |
0.63 |
| 26* | 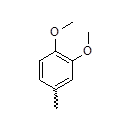 |
0.82 |
| 27* | 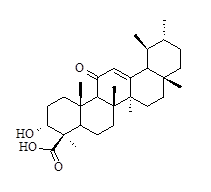 |
8.04 |
| 28* | 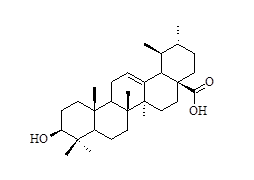 |
3.08 |
| Sl | R3 | IC50 (µM) |
|---|---|---|
| 29 |  |
0.62 |
| 30 | COCOOH | 2.86 |
| 31 | COCH2C(Me)2COOH | 2.33 |
Ph: Phenyl; Me: Methyl; Et: Ethyl
*indicates test set compounds
Table 1: Structural feature of oleanolic acid and its derivatives having PTP1B inhibitory activity.
The quantum chemical properties (EH, EL, μ) of the studied molecules have been determined by DFT/B3LYP calculation and the basis set 6-31G* was used. All quantum chemical calculations were performed with the Firefly (https://classic.chem.msu.su/gran/firefly/index.html). Molar refractivity (MR), molar volume (MV) and partition coefficient (logP) were determined using ChemSketch software (https://www.acdlabs.com/resources/freeware/chemsketch/). The binding energies (EB) of different ligands obtained from the docking study and solvent accessible surface area (SASA) of different inhibitors were calculated by Autodock Tools 1.5.6 (Sanner 1999).
Statistical methods
Multiple linear regression (MLR) analysis was used to build up QSAR models. Different combinations of parameters were tried to develop these models. On these selected parameters correlation analysis was done and intercorrelated parameters were eliminated. Statistical qualities of MLR equations were judged by parameters like correlation coefficient (R), square of the correlation coefficient (R2), cross validated coefficient (R2cv), standard deviation of the regression (S), Fischer statistics (F) and quality factor (Q). MLR program written by ourselves in Fortran-77 is used [14-18].
Results and Discussion
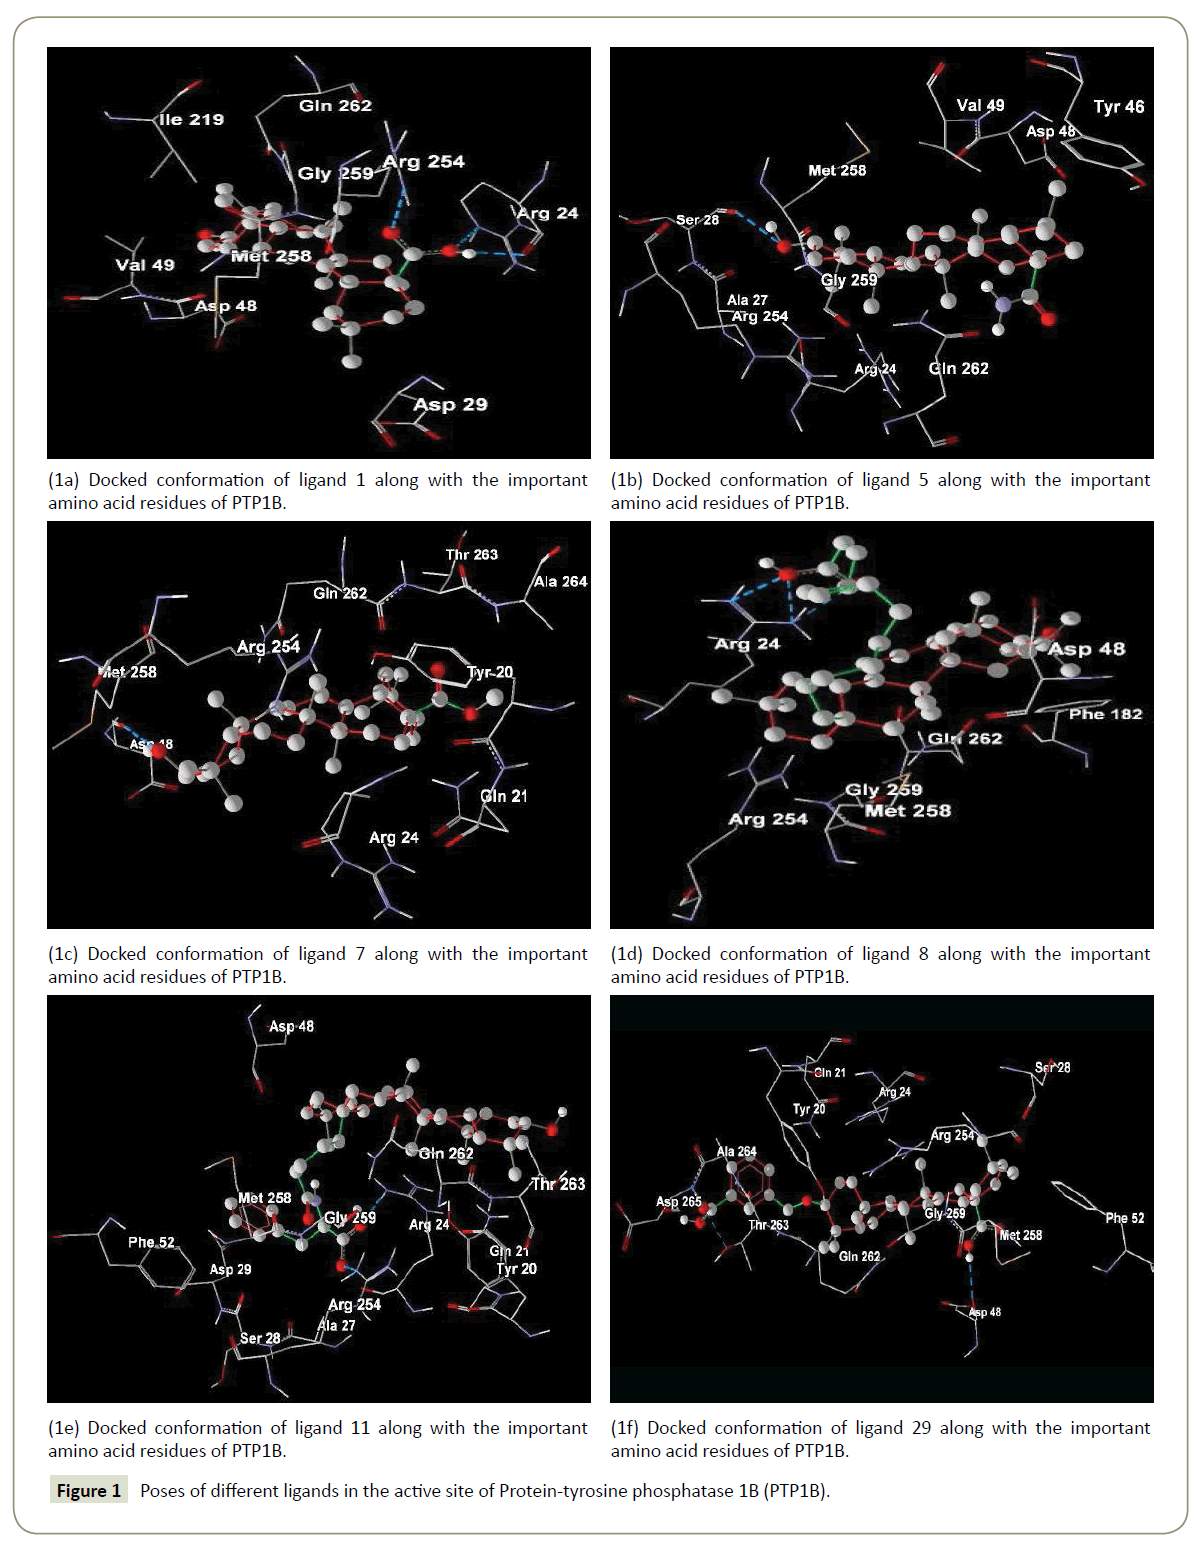
The binding energies of 35 ligands are ranges between -6.04 and -12.43 kcal/mol. The docking study shows both polar (TYR20, GLN21, ARG24, SER28, TYR46, ASP48, ASP181, ARG254, GLN262, THR263) and non polar (ALA27, VAL49, PHE182, ALA217, ILE219, MET258, GLY259) amino acids make important interactions to the inhibitors. Most of the ligands can form hydrogen bonds with ARG24 and/or ARG254.
Oleanolic acid (ligand 1) was used as a model drug (Figure 1a).
The –COOH group at C-17 forms two hydrogen bonds with ARG24 (1.885 Å) and ARG254 (1.901 Å). Substitution of –COOH group by –CONH2 and –COOMe results ligands 5 and 7 have lower biological activities. This is due to the fact that ligand 1 has higher –EB compared to ligands 5 and 7.Again the –CONH2 and –COOMe groups in ligands 5 (Figure 1b) and 7 (Figure 1c) do not make any hydrogen bond interaction with the enzyme.
The biological activity increases with increasing the carbon chain length at C-17 in ligands 2, 3, 4, 6 and 8. Except ligand 3, binding energy decreases with increasing chain size but their lipophilic efficiency increases. Again compound 8 has lower value of ΔEgap compared to the compounds 2, 3, 4 and 6 which suggest that complex formed between enzyme and ligand 8 (Figure 1d) is more stable than other. Compound 9 is an isomer of 11 though the biological activity of 9 is lower than 11. This is due to the ligand 9 has lower -EB than ligand 11 (Figure 1e).
For the compounds in the high bioactive range, such as compounds 11 to 26 (IC50<1 μM), there exists hydrogen bond (s) between amide backbone (especially with ARG24 and/or ARG254) and – (CH2)4 CONHCH (R2) COOH group. Ligands 29, 30 and 31 are obtained from compound 1 by the substitution at the C-3 position and have greater biological activity. The biological activity of compound 29 (Figure 1f) is greater than 30 and 31 due to higher lipophilic efficiency.
The data set of 35 compounds was divided into two groups. The training sets constitute 28 compounds (1,2,3,4,5,6,9,11,12,13,1 4,15,16,17,18,19,20,21,22,23,24,25,29,30,31,33,34,35) and the remaining 7 compounds (7,8,10,26,27,28,32) are part of the test sets. The list of the descriptors of training and test compounds are presented in Table 2.
| Sl | EB kcal/mol |
SASA | MR (cm3) | MV (cm3) |
log P | EH (hartree) | EL (hartree) |
µ (debye) |
|---|---|---|---|---|---|---|---|---|
| 1 | -9.95 | 693.68 | 133.57 | 414.90 | 9.06 | -0.2092 | -0.0371 | 4.8603 |
| 2 | -8.30 | 727.81 | 142.83 | 447.00 | 10.05 | -0.2238 | -0.0292 | 3.5940 |
| 3 | -9.04 | 797.18 | 152.09 | 479.20 | 11.08 | -0.2186 | -0.0137 | 4.0082 |
| 4 | -7.37 | 848.88 | 170.62 | 543.40 | 13.20 | -0.2208 | -0.0079 | 4.7519 |
| 5 | -8.62 | 694.83 | 135.66 | 421.1 | 8.11 | -0.2267 | 0.0109 | 4.4407 |
| 6 | -7.24 | 929.64 | 179.88 | 575.50 | 14.27 | -0.2190 | 0.0004 | 6.3005 |
| 7 | -8.60 | 712.99 | 138.41 | 439.70 | 9.52 | -0.2163 | -0.0128 | 2.0653 |
| 8 | -6.72 | 834.31 | 189.14 | 607.60 | 15.33 | -0.2054 | -0.0134 | 4.4429 |
| 9 | -7.13 | 952.31 | 194.45 | 590.10 | 12.14 | -0.2402 | -0.0173 | 6.0856 |
| 10 | -9.11 | 696.21 | 135.03 | 413.50 | 7.82 | -0.2205 | -0.0328 | 3.1187 |
| 11 | -9.44 | 919.25 | 194.45 | 590.10 | 12.14 | -0.2379 | -0.0210 | 8.6168 |
| 12 | -8.29 | 967.79 | 205.93 | 602.50 | 12.06 | -0.2786 | 0.1185 | 6.1512 |
| 13 | -6.86 | 940.36 | 187.01 | 577.90 | 11.17 | -0.2175 | -0.0486 | 3.7634 |
| 14 | -9.32 | 996.47 | 194.64 | 584.80 | 12.55 | -0.3437 | 0.1061 | 5.6645 |
| 15 | -8.46 | 993.24 | 194.64 | 584.80 | 12.55 | -0.3437 | 0.1061 | 5.6645 |
| 16 | -9.11 | 999.19 | 194.64 | 584.80 | 12.55 | -0.3437 | 0.1061 | 5.6645 |
| 17 | -7.05 | 989.79 | 189.93 | 578.40 | 12.01 | -0.3217 | 0.1186 | 2.1511 |
| 18 | -8.97 | 945.86 | 194.44 | 589.70 | 12.42 | -0.3083 | 0.1188 | 9.2002 |
| 19 | -9.64 | 945.02 | 195.85 | 584.70 | 11.69 | -0.3139 | 0.0314 | 6.0850 |
| 20 | -6.04 | 934.37 | 196.18 | 595.50 | 11.87 | -0.3209 | 0.1188 | 5.4226 |
| 21 | -8.19 | 958.45 | 196.18 | 595.50 | 11.87 | -0.3090 | 0.1137 | 4.1579 |
| 22 | -8.79 | 965.52 | 196.18 | 595.50 | 11.87 | -0.3113 | 0.1276 | 1.8820 |
| 23 | -8.49 | 985.10 | 195.87 | 582.20 | 11.82 | -0.3095 | 0.1498 | 3.1091 |
| 24 | -8.34 | 964.21 | 202.54 | 617.00 | 11.69 | -0.3055 | 0.1230 | 7.3918 |
| 25 | -12.43 | 905.20 | 202.54 | 617.00 | 11.67 | -0.3146 | 0.1115 | 1.8242 |
| 26 | -6.78 | 974.30 | 202.54 | 617.00 | 11.69 | -0.3026 | 0.1113 | 6.3092 |
| 27 | -9.42 | 691.71 | 133.69 | 412.50 | 7.10 | -0.2211 | -0.0540 | 4.4538 |
| 28 | -10.12 | 673.80 | 133.52 | 415.70 | 9.01 | -0.2250 | -0.0124 | 3.9526 |
| 29 | -8.69 | 890.55 | 169.40 | 507.50 | 11.41 | -0.3155 | 0.0891 | 1.9924 |
| 30 | -10.59 | 752.05 | 144.81 | 446.50 | 9.17 | -0.3375 | 0.0759 | 2.5937 |
| 31 | -10.59 | 828.68 | 163.34 | 511.20 | 10.27 | -0.3769 | 0.1443 | 4.0873 |
| 32 | -6.04 | 1073.27 | 230.27 | 682.00 | 14.49 | -0.3161 | 0.0811 | 3.1218 |
| 33 | -9.09 | 683.58 | 132.17 | 413.80 | 8.48 | -0.3441 | 0.1472 | 5.5761 |
| 34 | -8.65 | 684.99 | 133.57 | 414.9 | 9.06 | -0.3354 | 0.1487 | 4.6350 |
| 35 | -9.36 | 693.12 | 136.23 | 428.2 | 11.20 | -0.3281 | 0.1532 | 5.2573 |
Table 2: Binding energy (EB), solvent accessible surface area (SASA), molar refractivity (MR), molar volume (MV), partition coefficient (log P), HOMO energy (EH), LUMO energy (EL) and dipole moment (μ) of 41 PTP1B inhibitors.
Among the generated QSAR models; two models were finally selected. Model summary of two best models are given below:
Model 1
pIC50=-17.510236+(-0.0088) BE+(2.6299) lnSASA+(1.1996) EH+(0.1447) EL+(-0.0053) μ
N=28, R=0.96, R2=0.92, R2cv=0.87, F=50.60, S=0.35, Q=2.74
Model 2
pIC50=-9.718794+ (0.9222) lnSASA +(2.3374) lnMR+(-1.7038) lnMV+(0.8755) logP
N=28, R=0.95, R2=0.90, R2cv=0.78, F=51.75, S=0.31, Q=3.06
In these models, N is the number of data points; R is the correlation coefficient between experimental values and calculated values from the equation. R2 is the square of the correlation coefficient and it measures the goodness of fit of the regression equation. Cross validated coefficient (R2cv) gives an idea of the performance of the model. S is the standard deviation of the regression. Fischer statistics (F) is a ratio between variances calculated and observed activity. The larger value of F test signifies the QSAR model. Q is the quality factor. Q value measures predictive power of the QSAR models.
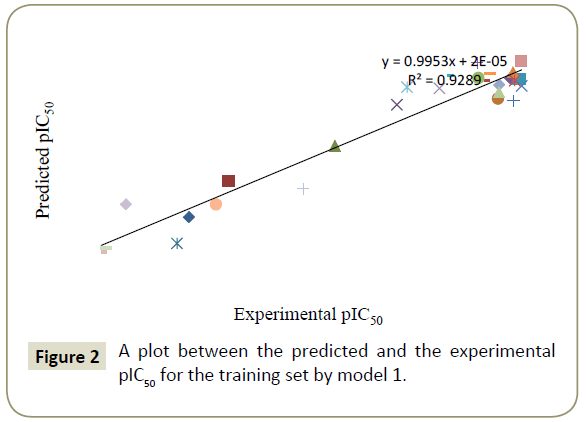
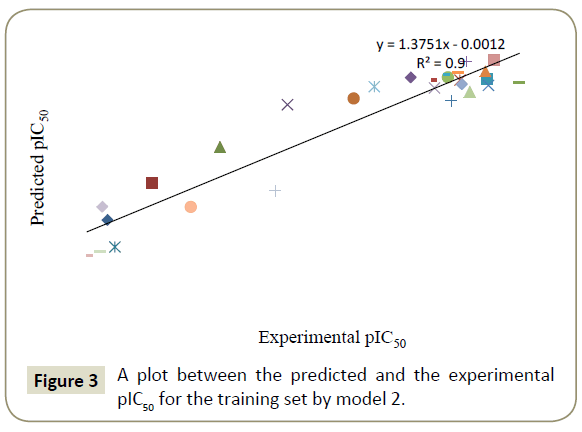
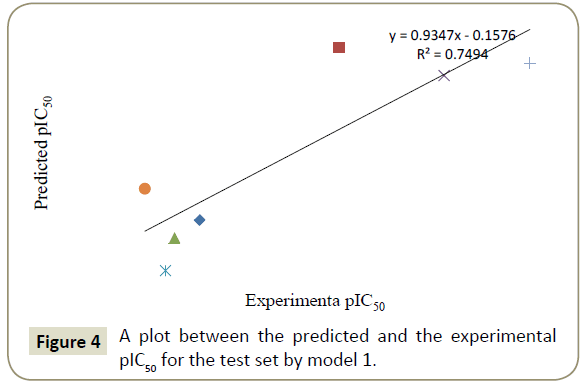
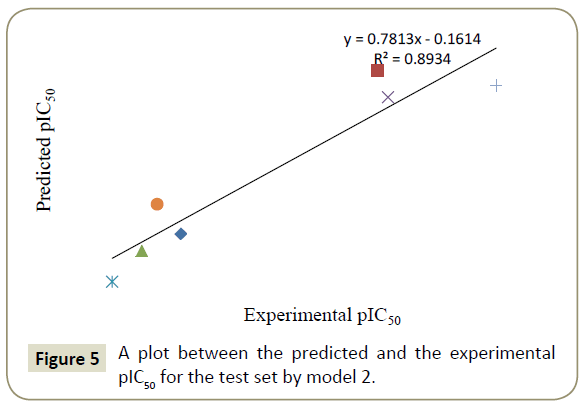
By using model number 1 and 2 the theoretical pIC50 values of 28 training compounds are given in Table 3 together with experimental pIC50. Using the model number 1 and 2, we calculated the theoretical pIC50 of the test set which appeared in Table 4. Statistical significance of these two models (model 1 and 2) were further supported by a plot of predicted pIC50 vs. experimental pIC50 (Figures 2 and 3) of training set inhibitors and give an idea about how fit model was trained and how well it predict the activity of the test set compounds (Figures 4 and 5).
| Compound no. | Experimental pIC50 | Predicted pIC50 (by Model 1) |
Predicted pIC50 (by Model 2) |
|---|---|---|---|
| 1 | -0.5276 | -0.4838 | -0.3975 |
| 2 | -0.3222 | -0.3896 | -0.3235 |
| 3 | -0.1239 | -0.1373 | -0.2111 |
| 4 | 0.1079 | 0.0106 | -0.0988 |
| 5 | -0.6776 | -0.5120 | -0.3849 |
| 6 | 0.1427 | 0.2506 | 0.0109 |
| 9 | 0.1308 | 0.2876 | 0.1724 |
| 11 | 0.2441 | 0.2179 | 0.1399 |
| 12 | 0.2291 | 0.2941 | 0.2858 |
| 13 | 0.2596 | 0.2793 | 0.1053 |
| 14 | 0.2518 | 0.3019 | 0.2319 |
| 15 | 0.2924 | 0.2859 | 0.2289 |
| 16 | 0.2147 | 0.3071 | 0.2344 |
| 17 | 0.2441 | 0.2907 | 0.1872 |
| 18 | 0.2596 | 0.2042 | 0.1671 |
| 19 | 0.3468 | 0.2010 | 0.1976 |
| 20 | 0.2757 | 0.1312 | 0.1600 |
| 21 | 0.284 | 0.2312 | 0.1834 |
| 22 | 0.2218 | 0.2532 | 0.1902 |
| 23 | 0.3565 | 0.3053 | 0.2437 |
| 24 | 0.1805 | 0.2525 | 0.2030 |
| 25 | 0.2007 | 0.1117 | 0.1448 |
| 29 | 0.2076 | 0.0345 | 0.0452 |
| 30 | -0.4564 | -0.4196 | -0.2592 |
| 31 | -0.3674 | -0.2117 | -0.1190 |
| 33 | -0.7259 | -0.6919 | -0.4312 |
| 34 | -0.7033 | -0.6798 | -0.4091 |
| 35 | -0.4548 | -0.6337 | -0.4060 |
Table 3: List of experimental and predicted pIC50 of 28 training compounds.
| Compound no. | Experimental pIC50 | Predicted pIC50 (by Model 1) |
Predicted pIC50 (by Model 2) |
|---|---|---|---|
| 7 | -0.6474 | -0.4297 | -0.5332 |
| 8 | 0.2291 | -0.0327 | 0.2077 |
| 10 | -0.7396 | -0.5013 | -0.6805 |
| 26 | 0.0862 | 0.2673 | 0.2471 |
| 27 | -0.9053 | -0.5266 | -0.7911 |
| 28 | -0.4886 | -0.5856 | -0.6220 |
| 32 | 0.15 | 0.5117 | 0.6540 |
Table 4: List of experimental and predicted pIC50 of 7 test compounds.
Model 1 revealed that solvent accessible surface area (SASA), HOMO energy (EH) and LUMO energy (EL) were contributed positively to the model where binding energy (EB) and dipole moment (μ) were contributed negatively to the model. Solvent accessible surface area (SASA), molar refractivity (MR), and partition coefficient (logP) were contributed positively where molar volume (MV) was contributed negatively to the model 2.
Conclusion
In conclusion, this QSAR study has shown that binding energy (EB), HOMO energy (EH), LUMO energy (EL), dipole moment (μ), molar refractivity (MR), molar volume (MV), solvent accessible surface area (SASA) and partition coefficient (logP) are the important parameters for determining the activity of oleanolic acid derivatives. Model 1 and model 2 are the best equation for predicting the inhibitory activity of Protein–tyrosine phosphatase 1B and these QSAR models may be used in prediction of activity of designed compound. The docking study shows that the important interacting amino acids present in the active site are TYR20, GLN21, ARG24, ALA27, SER28, TYR46, ASP48, VAL49, ASP181, PHE182, ALA217, ILE219, ARG254, MET258, GLY259, GLN262, THR263. Most of the ligands can form hydrogen bonds with ARG24 and/or ARG254. Binding energies and partion coefficient (logP) play an important role for predicting the activity of the inhibitors.
References
- Alonso A, Sasin J, Bottini N, Friedberg I(2004) Protein tyrosine phosphatases in the human genome. Cell 117: 699-711.
- Barford D, Das AK, Egloff MP (1998) The structure and mechanism of protein phosphatases: Insights into catalysis and regulation. Annu Rev Biophys Biomol Struc 27: 133-164.
- Barford D, Flint AJ, Tonks NK (1994) Crystal structure of human protein tyrosine phosphatase 1B. Science 263: 1397-1404.
- Castellano JM, Guinda A, Delgado T, Rada M, Cayuela JA (2013) Biochemical basis of the antidiabetic activity of oleanolic acid and related pentacyclic triterpenes. Diabetes 62: 1791-1799.
- Dzubak P, Hajduch M, Vydra D, Hustova A, Kyasnica M, et al.(2006) Pharmacological activities of natural triterpenoids and their therapeutic implications. Nat Prod Rep 23:394-411.
- Elchebly M, Payette P, Michaliszyn E, Cromlish W, Collins S, et al.(1999) Increased insulin sensitivity and obesity resistance in mice lacking the protein tyrosine phosphatase-1B gene. Science283: 1544-1548.
- Kenner KA, Anyanwu E, Olefsky JM, Kusari J (1996) Protein-tyrosine phosphatase 1B is a negative regulator of insulin- and insulin-like growth factor-I-stimulated signaling. J Biol Chem 271: 19810-19816.
- Liu J (1995) Pharmacology of oleanolic acid and ursolic acid. J Ethnopharmacol 49: 57-68.
- Liu J (2005) Oleanolic acid and ursolic acid: Research perspective. J Ethnopharmacol 100: 92-94.
- Martín R, Carvalho-Tavares J, Hernández M, Arnés M, Ruiz-Gutiérrez V, et al.(2010) Beneficial actions of oleanolic acid in an experimental model of multiple sclerosis: A potential therapeutic role. Biochem Pharmacol 79: 198-208.
- Morris GM, Goodsell DS, Halliday RS, Huey R, Hart WE, et al.(1998) Automated docking using a Lamarckian genetic algorithm and an empirical binding free energy function. J Comput Chem 19: 1639-1662.
- Puius YA, Zhao YU, Sullivan M, Lawrence DS, Almo SC, et al. (1997) Identification of a second aryl phosphate-binding site in protein-tyrosine phosphatase 1B: a paradigm for inhibitor design. Proc Natl Acad Sci 94: 13420-13425.
- Ramírez-Espinosa JJ, Rios MY, Martínez SL, Vallejo FL, Medina-Franco JL, et al.(2011) Antidiabetic activity of some pentacyclic acid triterpenoids, role of PTP-1B: in vitro, in silico, and in vivo approaches. Eur J Med Chem 46: 2243-2251.
- Sanner MF (1999) Python: A programming language for software integration and development. J Mol Graphics Mod 17: 57-61.
- Wiener JR, Kerns BJ, Harvey EL, Conaway MR, Iglehart JD, et al. (1994) Overexpression of the protein tyrosine phosphatase PTP1B in human breast cancer: Association with p185c-erbB-2 protein expression. J Natl Cancer Inst 86: 372-378.
- Zhang YN, Zhang W, Hong D, Shi L, Shen Q, et al.(2008) Oleanolic acid and its derivatives: New inhibitor of protein tyrosine phosphatase 1B with cellular activities. Bioorganic & Medicinal Chemistry 16: 8697-8705.
- Zhang ZY (1997) Structure mechanism and specificity of protein-tyrosine phosphatase. Curr Top Cell Regul 35: 21-68.
- Zhang ZY (1998) Protein-tyrosine phosphatases: Biological function, structural characteristics and mechanism of catalysis. Crit Rev Biochem Mol Biol 33: 1-52.
Open Access Journals
- Aquaculture & Veterinary Science
- Chemistry & Chemical Sciences
- Clinical Sciences
- Engineering
- General Science
- Genetics & Molecular Biology
- Health Care & Nursing
- Immunology & Microbiology
- Materials Science
- Mathematics & Physics
- Medical Sciences
- Neurology & Psychiatry
- Oncology & Cancer Science
- Pharmaceutical Sciences
